IUCN Threatened Species explored through the lens of aquatic environmental DNA (eDNA)

About this dashboard

This dashboard supports IUCN and Minderoo's efforts to better integrate environmental DNA-derived data into the IUCN Red List of Threatened Species, the world’s most trusted and widely used source for assessing species extinction risk. With hundreds of marine eDNA samples being collected every day across the globe, our ability to track threatened species is entering a new phase.

In this pilot Red List eDNA dashboard we explore a 6,000+ sample dataset from around Australia, the bulk of which was a collaboration with Parks Australia. This dashboard and dataset are being used to explore what features, visualisations and data agreements need to be in place to more rapidly interweave eDNA data from threatened species into IUCN’s Red List assessments.

About eDNA

Environmental DNA, or eDNA, refers to the traces of genetic material that all organisms leave behind in their environment through skin cells, scales, waste, mucus, or other biological matter. By filtering seawater, we can capture these fragments and analyse them in the lab to target specific sections of DNA that function like barcodes that are unique to each species. This allows us to non-invasively detect which organisms have recently been in the water, enabling detailed biodiversity assessments and improving our ability to monitor ecosystems. eDNA sample collection is highly scalable, providing the potential for vast amounts of biodiversity data to be fed into conservation tools such as the IUCN Red List of Threatened Species.

In the future when databases improve and we have better temporal, spatial and biomass estimates we anticipate the utility of eDNA in conservation decision making will ramp up. Watch this space!

Explore by

The biodiversity in our oceans is difficult to inventory. From microbes to whale sharks, eDNA represents a complimentary way to inventory life. Below are different ways to explore the data.

BETA

This is a beta release — we are continuing to build and improve these tools.

Key statistics

eDNA is being routinely used to monitor biodiversity in aquatic environments at unprecedented scales. These data add critical layers of information on species presence and range, providing valuable evidence to inform and strengthen IUCN Red List assessments and conservation planning.

77%

OF VALID FISHES WITH PUBLISHED RED LIST ASSESSMENTS

>6,000

MARINE eDNA SAMPLES

This dashboard is powered by more than 6,000 marine eDNA samples collected across Australia’s oceans.

91

THREATENED AND NEAR THREATENED SPECIES

This dataset detected 91 species that have been assessed as Threatened or Near Threatened according to the IUCN Red List.

91

DATA DEFICIENT SPECIES

We detected 91 species that have been classified as Data Deficient in IUCN Red List Assessments, meaning we don’t have enough data to classify their extinction risk. Future eDNA sampling will help reduce this number over time!

Case studies

eDNA can tell us so much about biodiversity and the environment. Here are just some of the stories we have been able to tell using eDNA data.

Frequently asked questions

eDNA offers a non-invasive, cost-effective, and highly sensitive approach for detecting marine life. It can reveal the presence of rare, cryptic, deep-sea or hard-to-observe species without needing to catch or see them, making it a powerful complementary tool for biodiversity monitoring and conservation.

Yes and no. While there are correlations between eDNA signal strength and factors like biomass or abundance, standard eDNA approaches, (like broad scale metabarcoding) are not yet reliable for estimating exact numbers. However, some species-specific techniques, such as quantitative PCR (qPCR), can provide more precise estimates of abundance or biomass for target species.

Also, it can give us an idea on the relative proportion of the animals, for example, we can use eDNA to detect the seasonal changes in presence of a certain animal, or changes across an area. For example, inside and outside a marine park.

eDNA can detect a wide range of organisms, from microbes to large vertebrates, as long as their DNA is present in the environment and matches reference databases. The type of assay used will determine which groups of organisms are targeted for detection.

Last updated: 13/02/2026

View release notes

Explore by species

This tool provides detailed insights into the presence and occurrence of marine species using eDNA. Use it to explore where and when species have been detected.

Photo credit: John Sear

Use the filters below to search by species name and detection date range to explore when and where species have been identified.

Species

* Species distribution model available

Location
Time range

Explore by IUCN Red List of Threatened Species extinction risk category

Photo credit: John Sear

Use the filters below to search by IUCN Red List extinction risk category, location and date range.

1. Slide to select IUCN Red List status
2. Hit the search button to execute the query
3. Explore the detections via an interactive map

Chat with the eDNA data

Ever wanted to ask the ocean a question? Now you can… sort of. Use our AI-powered tool to ask anything you’d like of the eDNA data.

This AI-powered tool lets you explore the eDNA data from Minderoo’s marine expeditions. It's the first tool of its kind to use artificial intelligence to interrogate eDNA data and generate biodiversity insights in real time. Just type in your question and let the model dive into the data for you. Here, we use Anthropic's Claude 4.5 Sonnet, a LLM that can write Python code in the background to answer your questions.

Whether you're curious about sharks, searching for the southernmost fish, or comparing biodiversity between regions, this tool helps turn complex genomic data into accessible insights.
Examples:
“Are there any IUCN listed sharks in the data?”
“What proportion of the eDNA samples had whales in them?”

A few things to keep in mind:

  • Be patient. It might take a few moments to process your request; the tool is searching through billions of lines of eDNA data to find the answer.
  • Don't take the results at face value. Always verify independently.
  • Try rephrasing your question. You might get a better answer the second time.
  • Be specific. For example, asking about “sharks” might return different groups like Chondrichthyes, Elasmobranchii, or Carcharhiniformes.
  • Ask it to check itself. You can prompt it to explain or critique its own answer.
  • Species distribution questions may differ. The LLM tool doesn’t just look at IUCN data and estimations/models of species distributions varies.

Ask me anything
Answer
The final answer appears here.
Bad question appears here

Last updated: 13/02/2026

View release notes

Introduction

To estimate extinction risk, the IUCN Red List methodology applies five criteria related to range size and population size and trends alongside quantitative thresholds to assign a species to one of nine Red List categories. Species-specific data on distribution, population trend, ecology, threats, and conservation measures are used to support each assessment.

How eDNA supports IUCN Red List assessment

The IUCN Red List of Threatened Species is the world’s most trusted and widely used source for assessing species extinction risk, making use of biodiversity data and expert assessments to help guide conservation efforts and decision-making across the globe. However, these assessments are only as good as the data that goes into them, and decision-making is often hampered by limited usable data.

Tracking biodiversity using eDNA is emerging as a new source of biodiversity data, yet has not been widely used in Red List assessments. The collection of eDNA samples is relatively straightforward and can be collected in a variety of ways, from citizen science projects to automated methods. eDNA approaches can also be untargeted, providing biodiversity data across the tree of life. As such, eDNA approaches can be used to generate comprehensive biodiversity data across vast spatial and temporal scales, assisting IUCN Red List of Threatened Species assessments.

About eDNA

Environmental DNA (or eDNA) is a technique where genetic “breadcrumbs” (that all animals leave behind) are recovered from water, soil or even the air!

In a laboratory DNA barcodes are ‘photocopied’ from the environmental sample and sequenced to determine the species present in the samples.

As DNA databases improve over time so too does the eDNA data - like the biota in the ocean eDNA data needs to be alive!

OceanOmics info

Check out more on eDNA at the OceanOmics web page:

Find out more here

Frequently asked questions

A Red List distribution map is based on expert knowledge, published literature, museum specimen collections and verifiable records from records databases such as GBIF and iNaturalist. Freshwater species maps are drawn by hydrographic catchment basin. Marine species maps are drawn as polygons with coastal species represented by clipping to a shoreline buffer of 100 km from shore or a depth of 200 m, whichever is closer. Deep and/or oceanic pelagic species are drawn by extending this shoreline buffer appropriate to its known occurrence. These exaggerated extents are applied for the purposes of visualization at large spatial scales as well as standardizing across the thousands of marine species that are mapped for display on the Red List website. These exaggerated buffers should be removed when analyzing geographic patterns at finer spatial scales, especially when calculating range size and conservation area planning.

The length of time between assessment updates varies, but as a rule, an assessment is labelled as outdated after ten years.

All valid species can be assessed except microorganisms. The taxonomic authority the Red List follows to determine validity of fish species is Eschmeyer’s Catalog of Fishes. If a name change occurs or the validity of a species changes, it is not automatically updated on the Red List. Though efforts are currently ongoing, all valid fish species are not yet published on the Red List as of 2025.

About

This dashboard supports IUCN and Minderoo efforts to better integrate environmental DNA-derived data into the IUCN Red List of Threatened Species, the world’s most trusted and widely used source for assessing species extinction risk. With hundreds of marine eDNA samples being collected every day across the globe our ability to track threatened species is entering a new phase.

In this pilot Red List eDNA dashboard we explore a 6,000+ sample dataset from around Australia the bull of which was a collaboration with Parks Australia. This dashboard and dataset are being used to explore what features, visualisations and data agreements need to be in place to more rapidly interweave eDNA data from threatened species into IUCN’s Red List assessments.

Contact

If you have any questions or feedback, please contact:

Neil Cox

Manager

IUCN-CI Biodiversity Assessment Unit

neil.cox@iucn.org

Matthew Fraser

Manager

Biodiversity and Ecology

mfraser@minderoo.org

Acknowledgements

Acknowledgement of Country

We respectfully acknowledge the Traditional Custodians of the Sea Country across all regions visited during our expeditions. We honour their enduring connection to the ocean and recognise the deep knowledge, care, and custodianship that First Nations peoples have sustained for millennia. We pay our respects to Elders past, present, and emerging, and extend that respect to all Aboriginal and Torres Strait Islander peoples.
We acknowledge that the waters, reefs, islands, and marine life we sampled and explored are part of living cultural landscapes. We are deeply grateful for the opportunity to conduct research on Country. In the spirit of reconciliation, we remain committed to listening to, learning from, and partnering with First Nations communities in our efforts to understand, protect, and conserve these vital ecosystems for future generations.

Community and Partners

This work was only possible with the support of community partners and collaborators across multiple regions, and we extend a heartfelt thanks to all of our collaborators on land whose support was instrumental to the success of this project. This includes the staff of DCCEEW and Parks Australia; the Shires of Christmas Island and Cocos (Keeling) Islands; Cocos Marine Care; Sea Country Solutions; the Yamatji Sea Rangers; and the Esperance Tjaltjraak Native Title Aboriginal Corporation.

Minderoo OceanOmics Centre at UWA

Minderoo OceanOmics Centre at the University of Western Australia brings together advanced molecular capabilities to support genomic research across marine systems. We sincerely acknowledge the OceanOmics Centre team for their unwavering dedication, perseverance, and outstanding efforts in processing complex samples to produce big data. Their technical leadership and commitment to delivering high-quality genomic outputs, is integral to our ability to translate raw expedition data into meaningful insights that advance our understanding of marine biodiversity.

IUCN Marine Biodiversity Unit Marine Biodiversity Unit About IUCN IUCN Red List of Threatened Species - Background & History

The IUCN Marine Biodiversity Unit (MBU) produces Red List assessments of marine species of the world and also leads the SSC Marine Fishes Red List Authority.

Parks Australia

Since 2021, Minderoo, with the support of Parks Australia, spearheaded the collection of over 6,000 marine eDNA samples – generating the most extensive marine eDNA dataset in Australian waters to date. This collection was co-funded by the Australian Government and the Minderoo Foundation under the Ocean Discovery and Restoration (ODR) Program. We acknowledge the Australian Government for their sustained commitment through the ODR program. This strategic partnership has helped accelerate and unlock new insights in marine science and conservation. All data collected is made publicly available on the Minderoo landing page (https://edna.minderoo.org), on ripple Parks instance (https://marine-parks.minderoo.org), and through the Global Biodiversity Information Facility (GBIF) and the Ocean Biodiversity Information System (OBIS) which provide free, open access biodiversity data from around the world.

CSIRO National Biodiversity DNA Library (NBDL)

The CSIRO National Biodiversity DNA Library is an initiative to generate the comprehensive reference sequences needed to identify Australia’s biodiversity from DNA. The initiative is a collaboration between CSIRO, Australia’s research collections and a range of philanthropic and government agencies. The NBDL will generate data from expertly identified specimens held in Australia’s museums and herbaria, bringing new capability to biodiversity research, and enabling the uptake of new technologies to describe and detect changes in biodiversity from DNA that organisms leave behind in the environment. The NBDL will launch as a digital platform with its first available data in 2025. The findings presented here are powered by provisional reference data provided under a partnership with the CSIRO National Biodiversity DNA Library, for which we extend our thanks to NBDL collection partners and Bioplatforms Australia.

Technology partners

At sea operations

A big thanks to all the captains and dedicated crew from Pangaea Ocean Explorer, Immortalis and the R.V. Investigator. Your support, expertise, and seamanship made it possible for us to reach some of the most remote and pristine corners of the ocean - and to document the magnificent marine life that thrives there. We couldn’t have done it without you.

Illumina

We extend our deepest thanks to Illumina for their critical and ongoing collaboration. Their cutting-edge sequencing technology has been integral to the generation of all the genomic data featured in this project. From support for at-sea sequencing during expeditions to high-throughput operations at Minderoo OceanOmics Centre at UWA, Illumina’s collaboration and expertise have been indispensable to our efforts to accelerate marine biodiversity discovery and conservation.

Ocean Diagnostics

We gratefully acknowledge the team at Ocean Diagnostics for their collaboration, innovation, and steadfast support. Their instrumentation transformed the way we collect eDNA in the field, enabling efficient, high-quality sampling even in remote and logistically challenging environments. We’re especially thankful for their responsive technical support, which has been invaluable during fieldwork.

Wilderlab

We're grateful to Wilderlab for providing comprehensive tree-of-life eDNA data that extended far beyond our vertebrate focus. Their accessible visualisation tools help make complex biodiversity results easier to explore and interpret. We appreciate their ongoing support and collaboration in advancing the use of eDNA monitoring in our region.

Designed and developed by Epi

Thanks to Epi for their careful design and expert data science which has brought our complex, multi-million dollar eDNA dataset to life. We couldn’t be more happy with the result — a collaborative process from day one that has empowered both us, and end users, that visit this dashboard. We appreciate their ongoing support and collaboration in advancing the usability of eDNA data.

Release notes

The release notes page provides a detailed record of updates, enhancements, and new features for the dashboard. It allows users to track version history, understand the latest functionality, and see improvements over time. Each entry includes release dates, version numbers, and descriptions of added tools, integrations, and technical updates, helping users stay informed about the evolution of the platform.

13/02/2026

V 1.0.0 – IUCN Red List eDNA Dashboard Initial Release

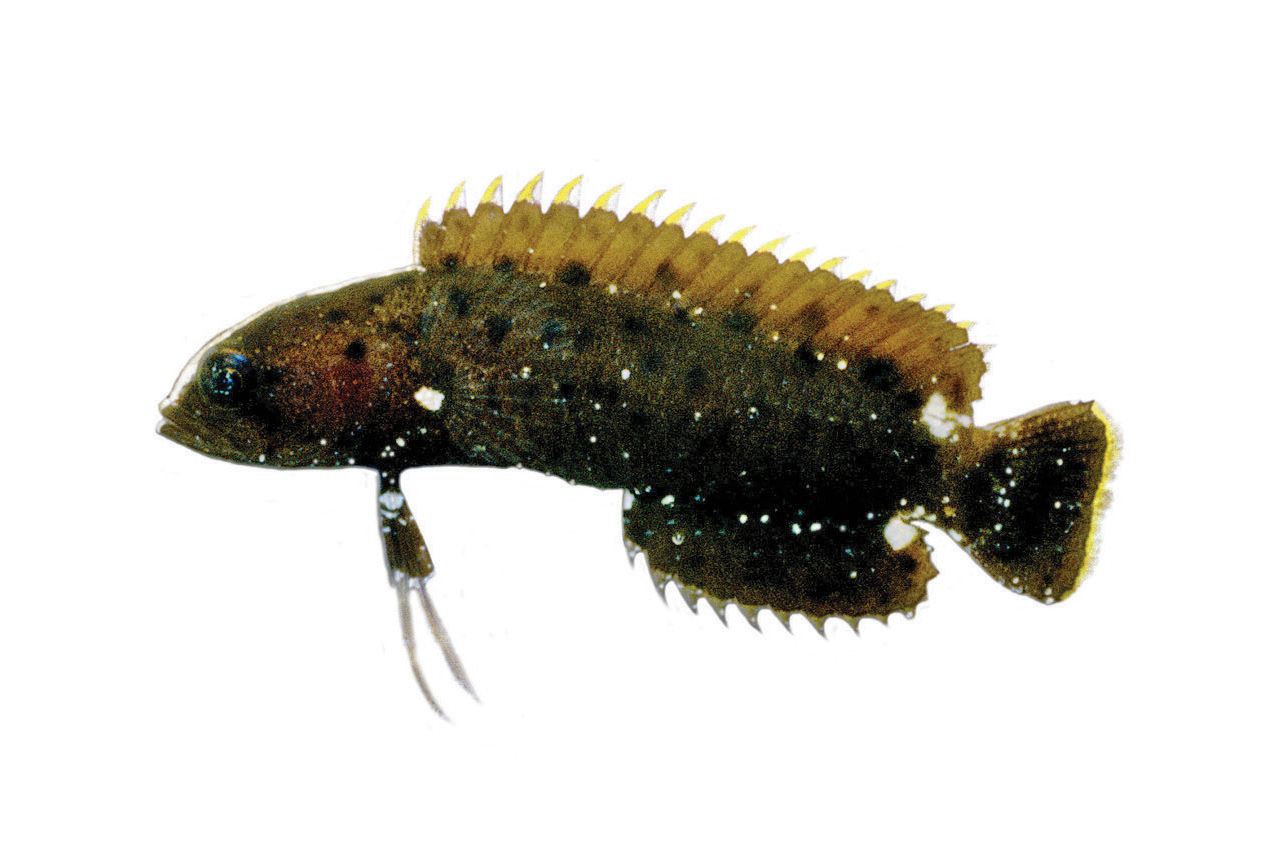
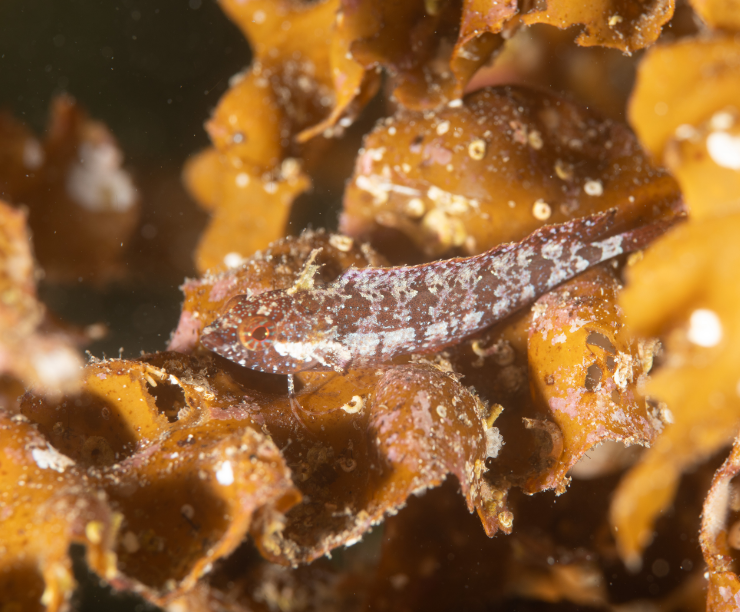
  • Species Exploration Tools: Interactive dashboard for exploring marine species through environmental DNA (eDNA) data with filtering by species name, IUCN Red List status, location, and date range

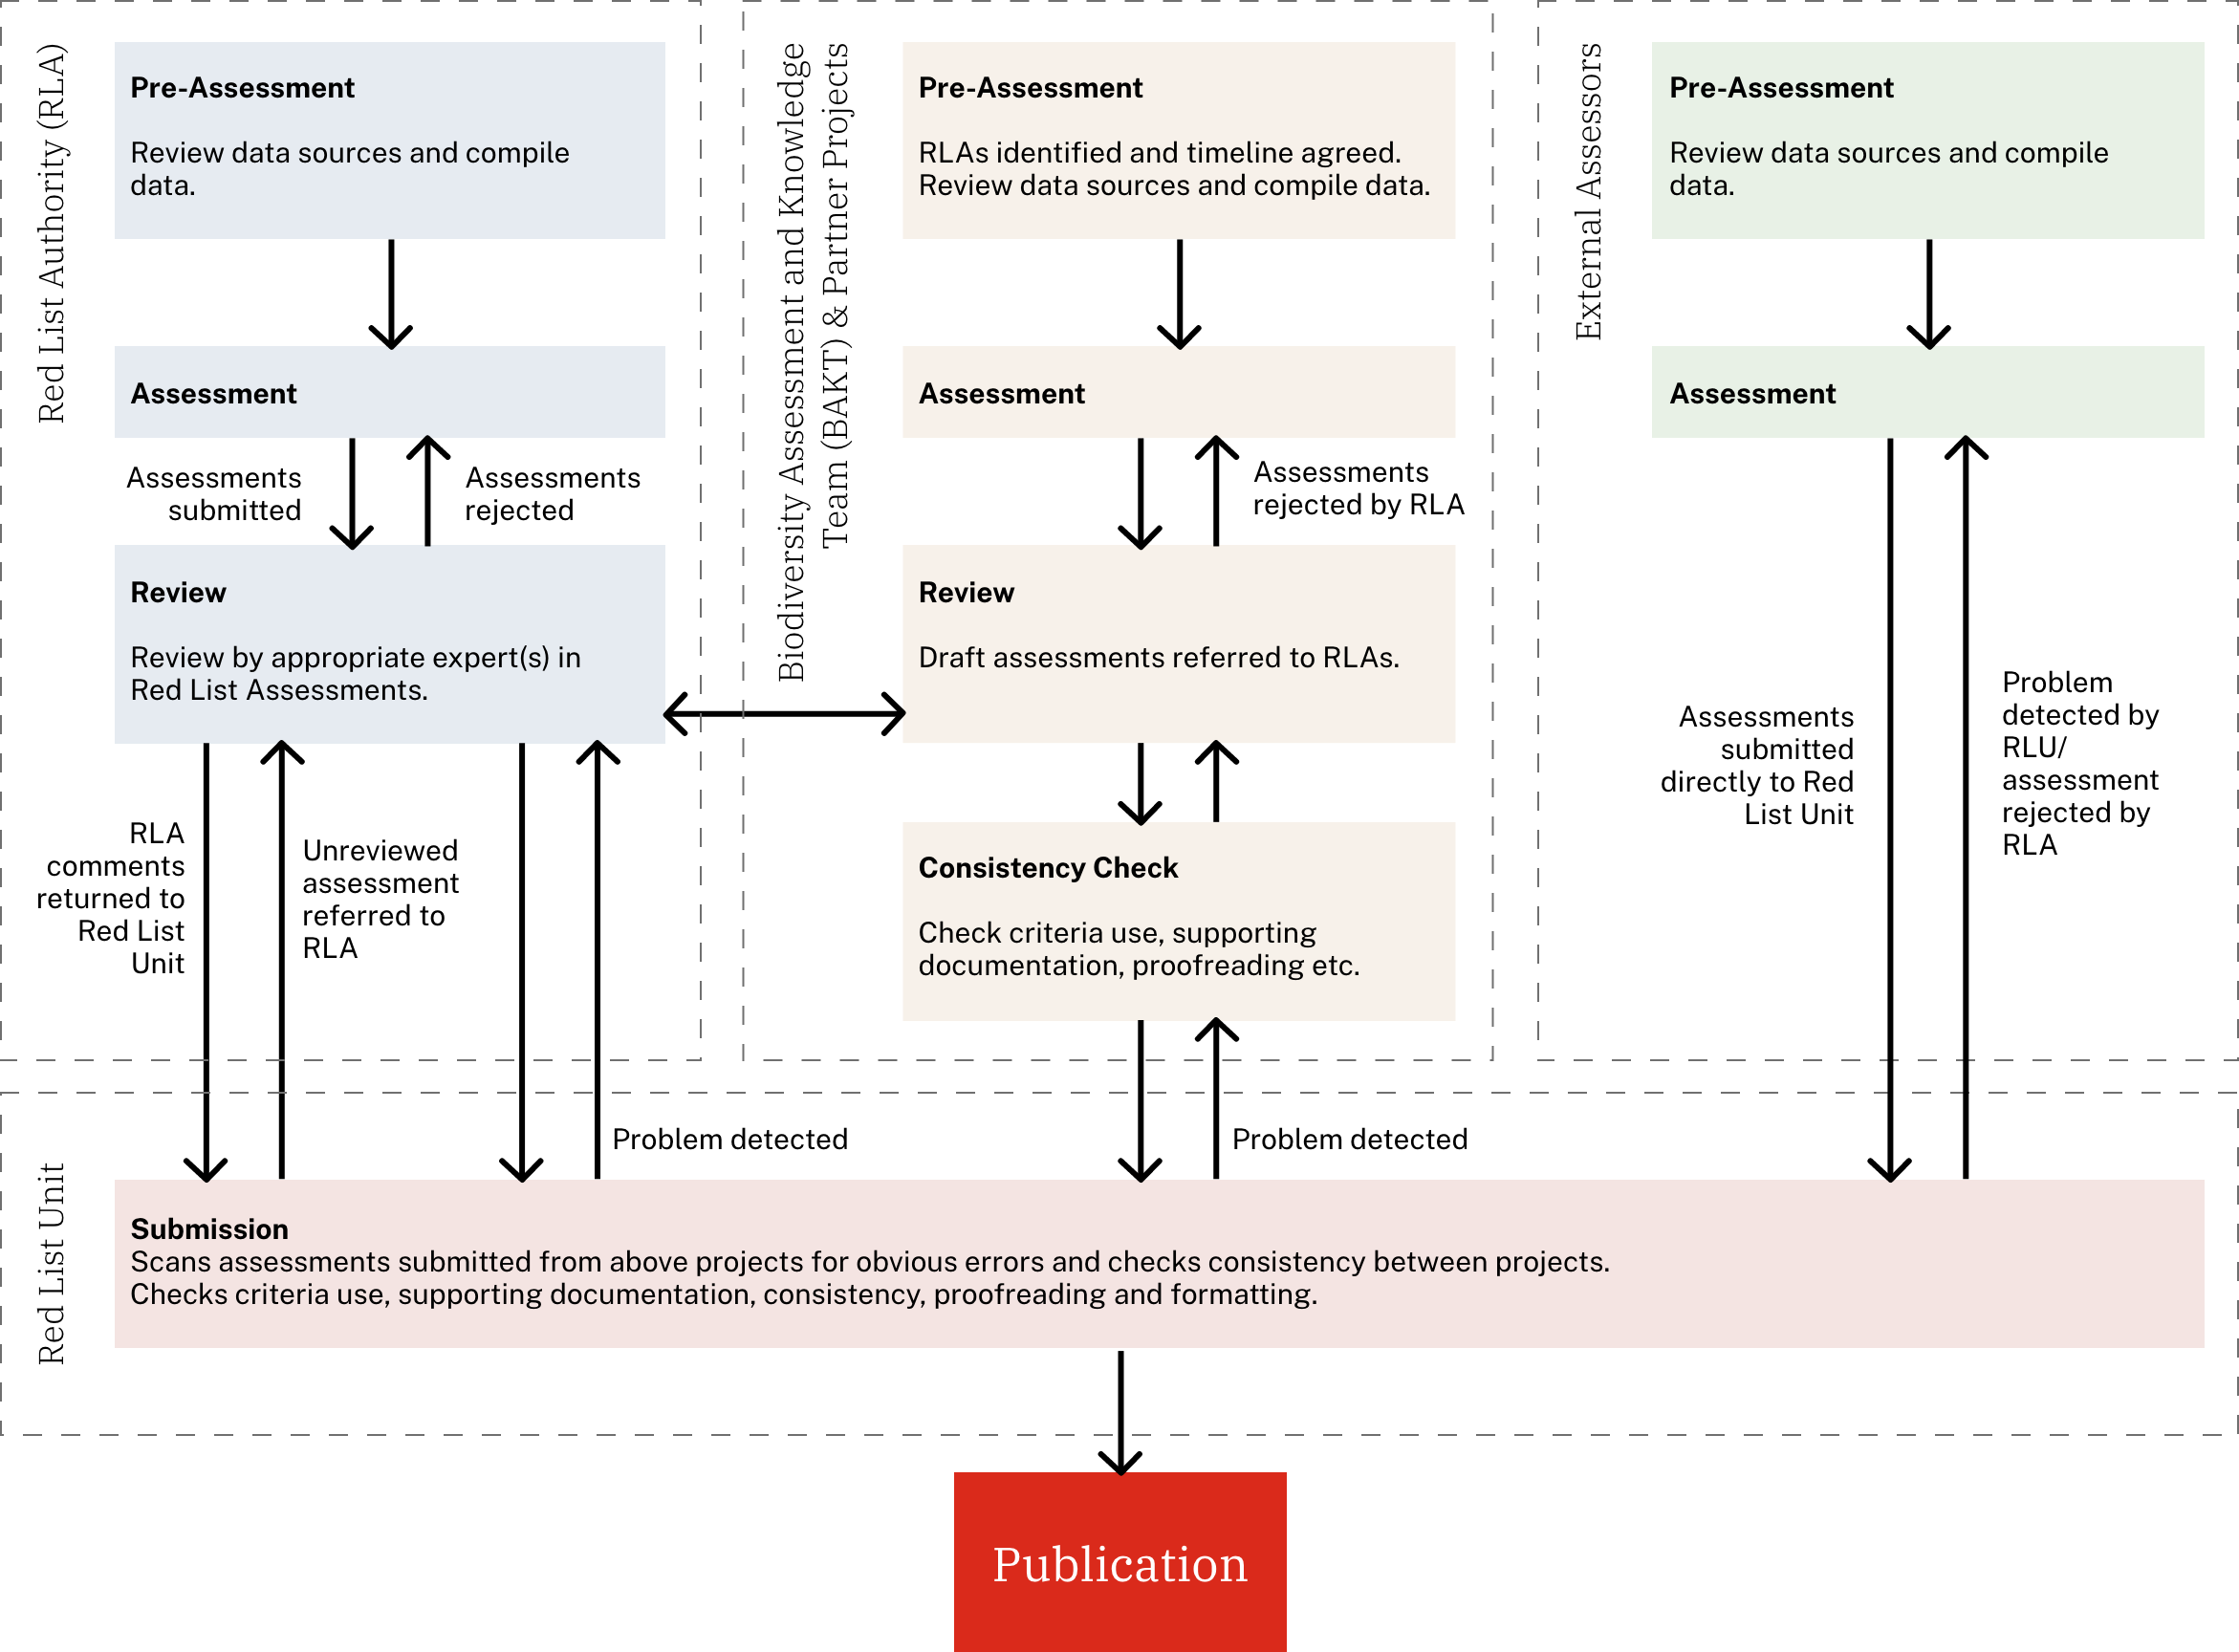
  • IUCN Red List Integration: Complete integration with IUCN Red List categories including Critically Endangered, Endangered, Vulnerable, Near Threatened, Least Concern, Data Deficient, and Not Evaluated species

  • Interactive Mapping: Advanced MapLibre-based mapping system featuring marine park boundaries, species detection clusters, timeline animation controls, and customizable map views with satellite and street map options

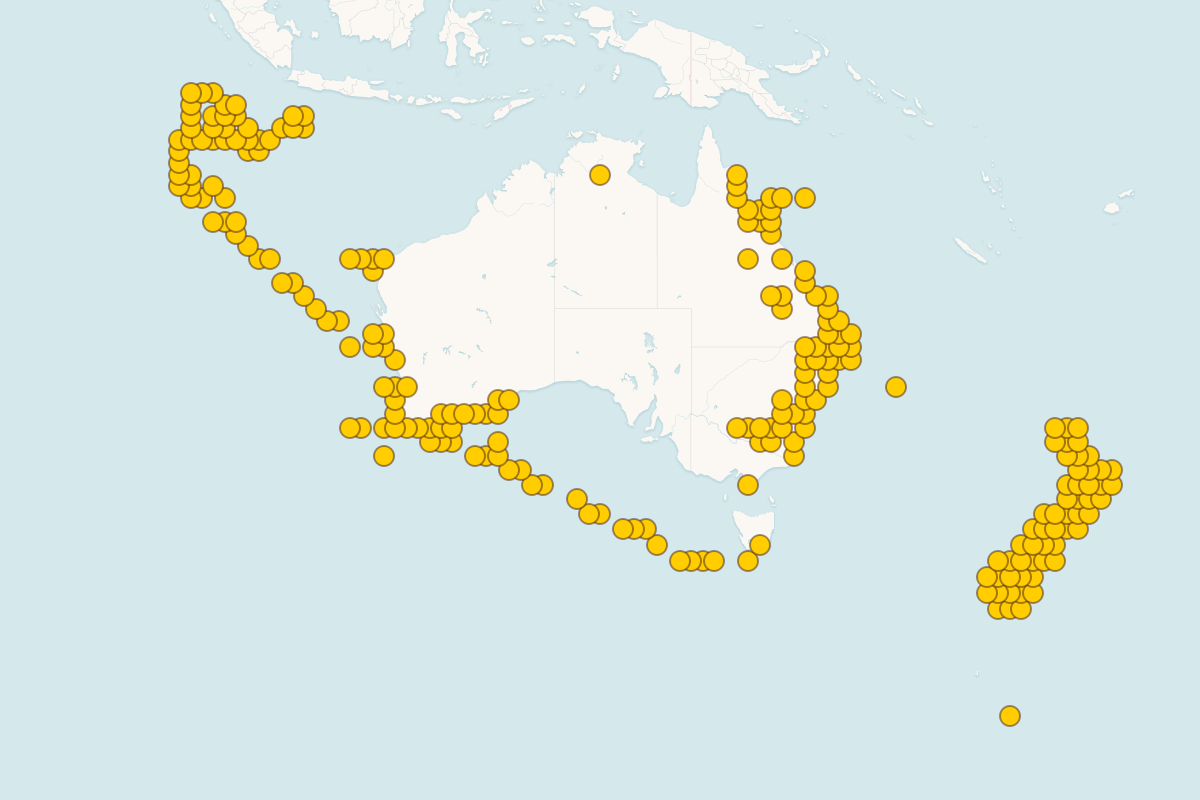
  • Data Visualization: Dynamic charts including detections over time plots, species distribution maps, and comprehensive data tables showing eDNA sample locations and detection frequencies

  • Marine Parks Integration: Full integration with Parks Australia marine park network data, allowing exploration of species within protected areas and park-specific biodiversity insights

  • AI-Powered Data Chat: Revolutionary AI chat interface powered by Anthropic's Claude 4.5 Sonnet for natural language queries about the eDNA dataset, enabling real-time biodiversity insights

  • Assessment Tools: Specialized tools for IUCN assessors including data availability indicators, voucher sequence information, and base pair identity analysis for taxonomic verification

  • Comprehensive Dataset: Analysis of 6,000+ marine eDNA samples collected around Australia in collaboration with Parks Australia, covering diverse marine ecosystems

  • User Experience: Guided tours and interactive tutorials, responsive design with Bootstrap 5, real-time data filtering, and export capabilities for research and assessment workflows

  • Technical Infrastructure: Built on R Shiny with modern web technologies, Docker containerization, robust data processing pipeline using the targets framework, and SCSS-based styling system

This pilot dashboard represents the first-of-its-kind integration of environmental DNA data with IUCN Red List assessments, supporting efforts to rapidly incorporate eDNA evidence into global species extinction risk evaluations.

Resources

IUCN Red List learning materials

https://www.iucnredlist.org/resources/grid

This website has freely available documents that provide details on the Red List methodology.

Not found